BANK OF HAWAII (BOH)·Q4 2025 Earnings Summary
Bank of Hawaii Posts 7th Straight Quarter of Margin Expansion, EPS Jumps 64% YoY
January 26, 2026 · by Fintool AI Agent
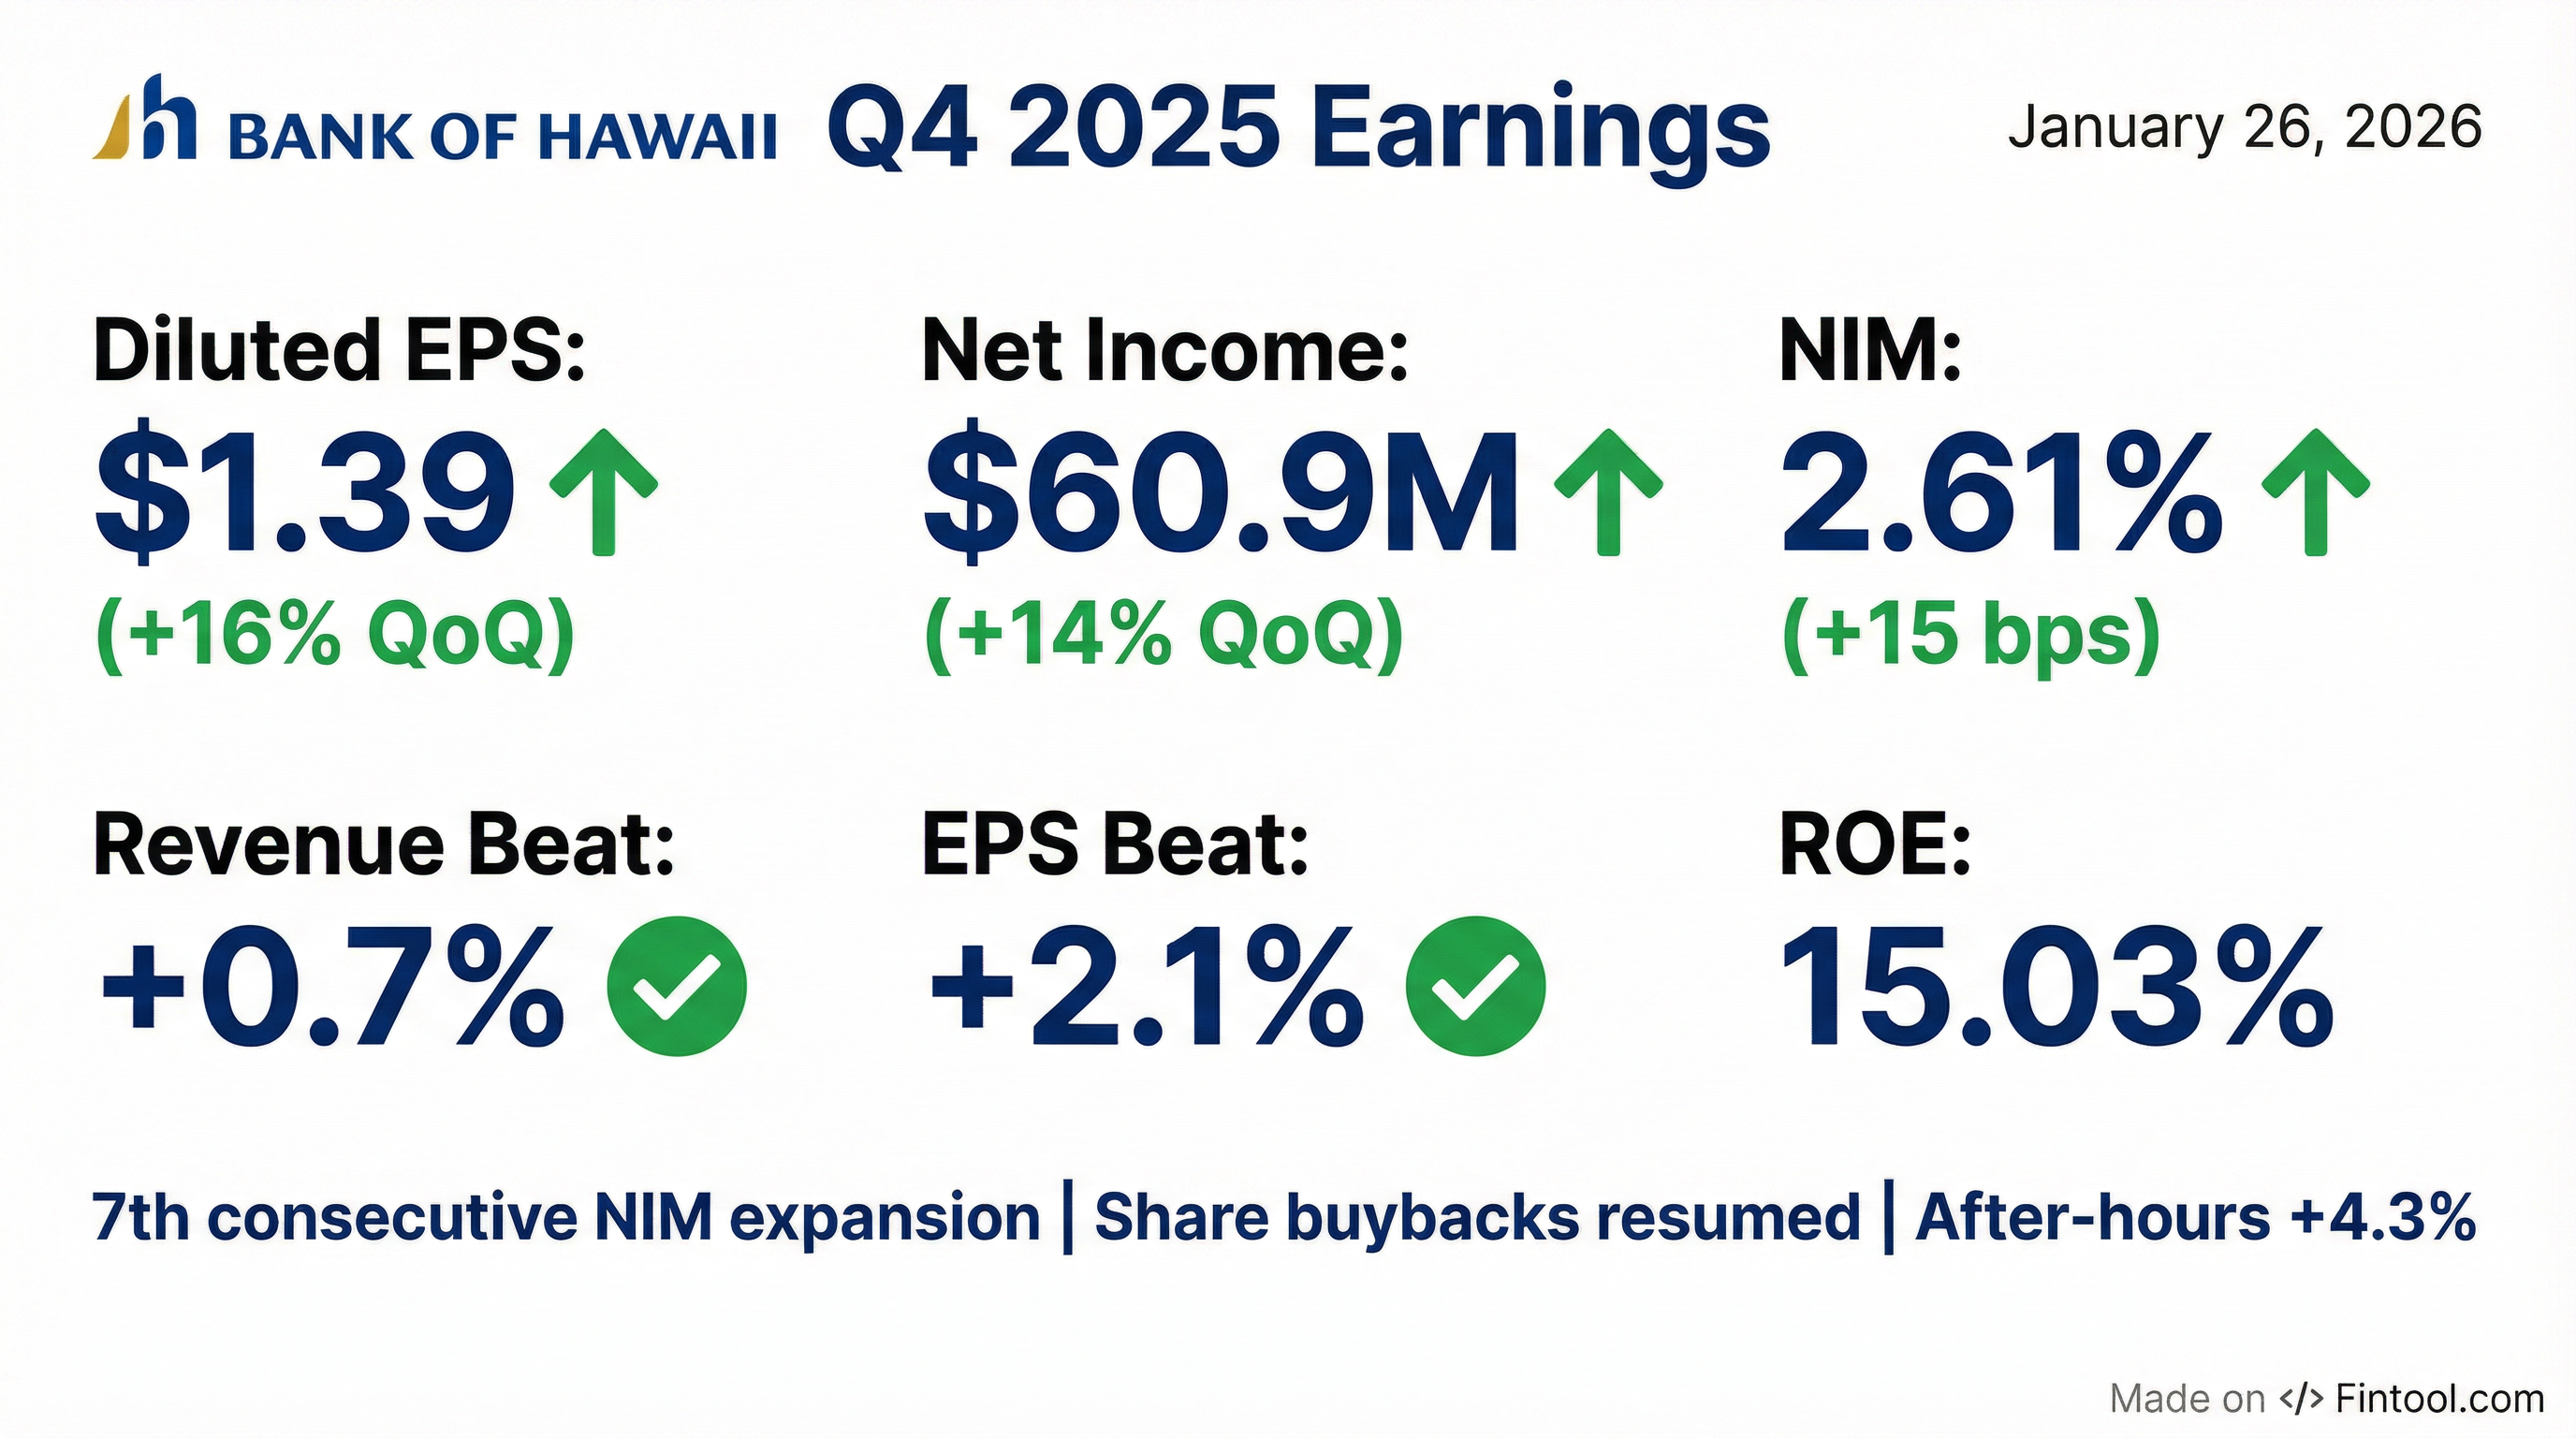
Bank of Hawaii (NYSE: BOH) delivered a strong Q4 2025 with diluted EPS of $1.39, up 16% sequentially and 64% year-over-year. The Hawaii-focused regional bank beat both revenue and EPS consensus estimates while extending its net interest margin expansion streak to seven consecutive quarters.
Did Bank of Hawaii Beat Earnings?
Yes — BOH beat on both revenue and EPS.
The company reported net income of $60.9 million, up 14.2% from Q3 2025 and up 55.6% from Q4 2024. Full-year 2025 net income reached $205.9 million, a 37.3% increase from 2024.
8-Quarter EPS Trend:
What Drove the Beat?
Net Interest Margin Expansion — 7th Consecutive Quarter
The standout story continues to be margin expansion. Net interest margin reached 2.61% in Q4 2025, up 15 basis points from Q3 and up 42 basis points year-over-year.
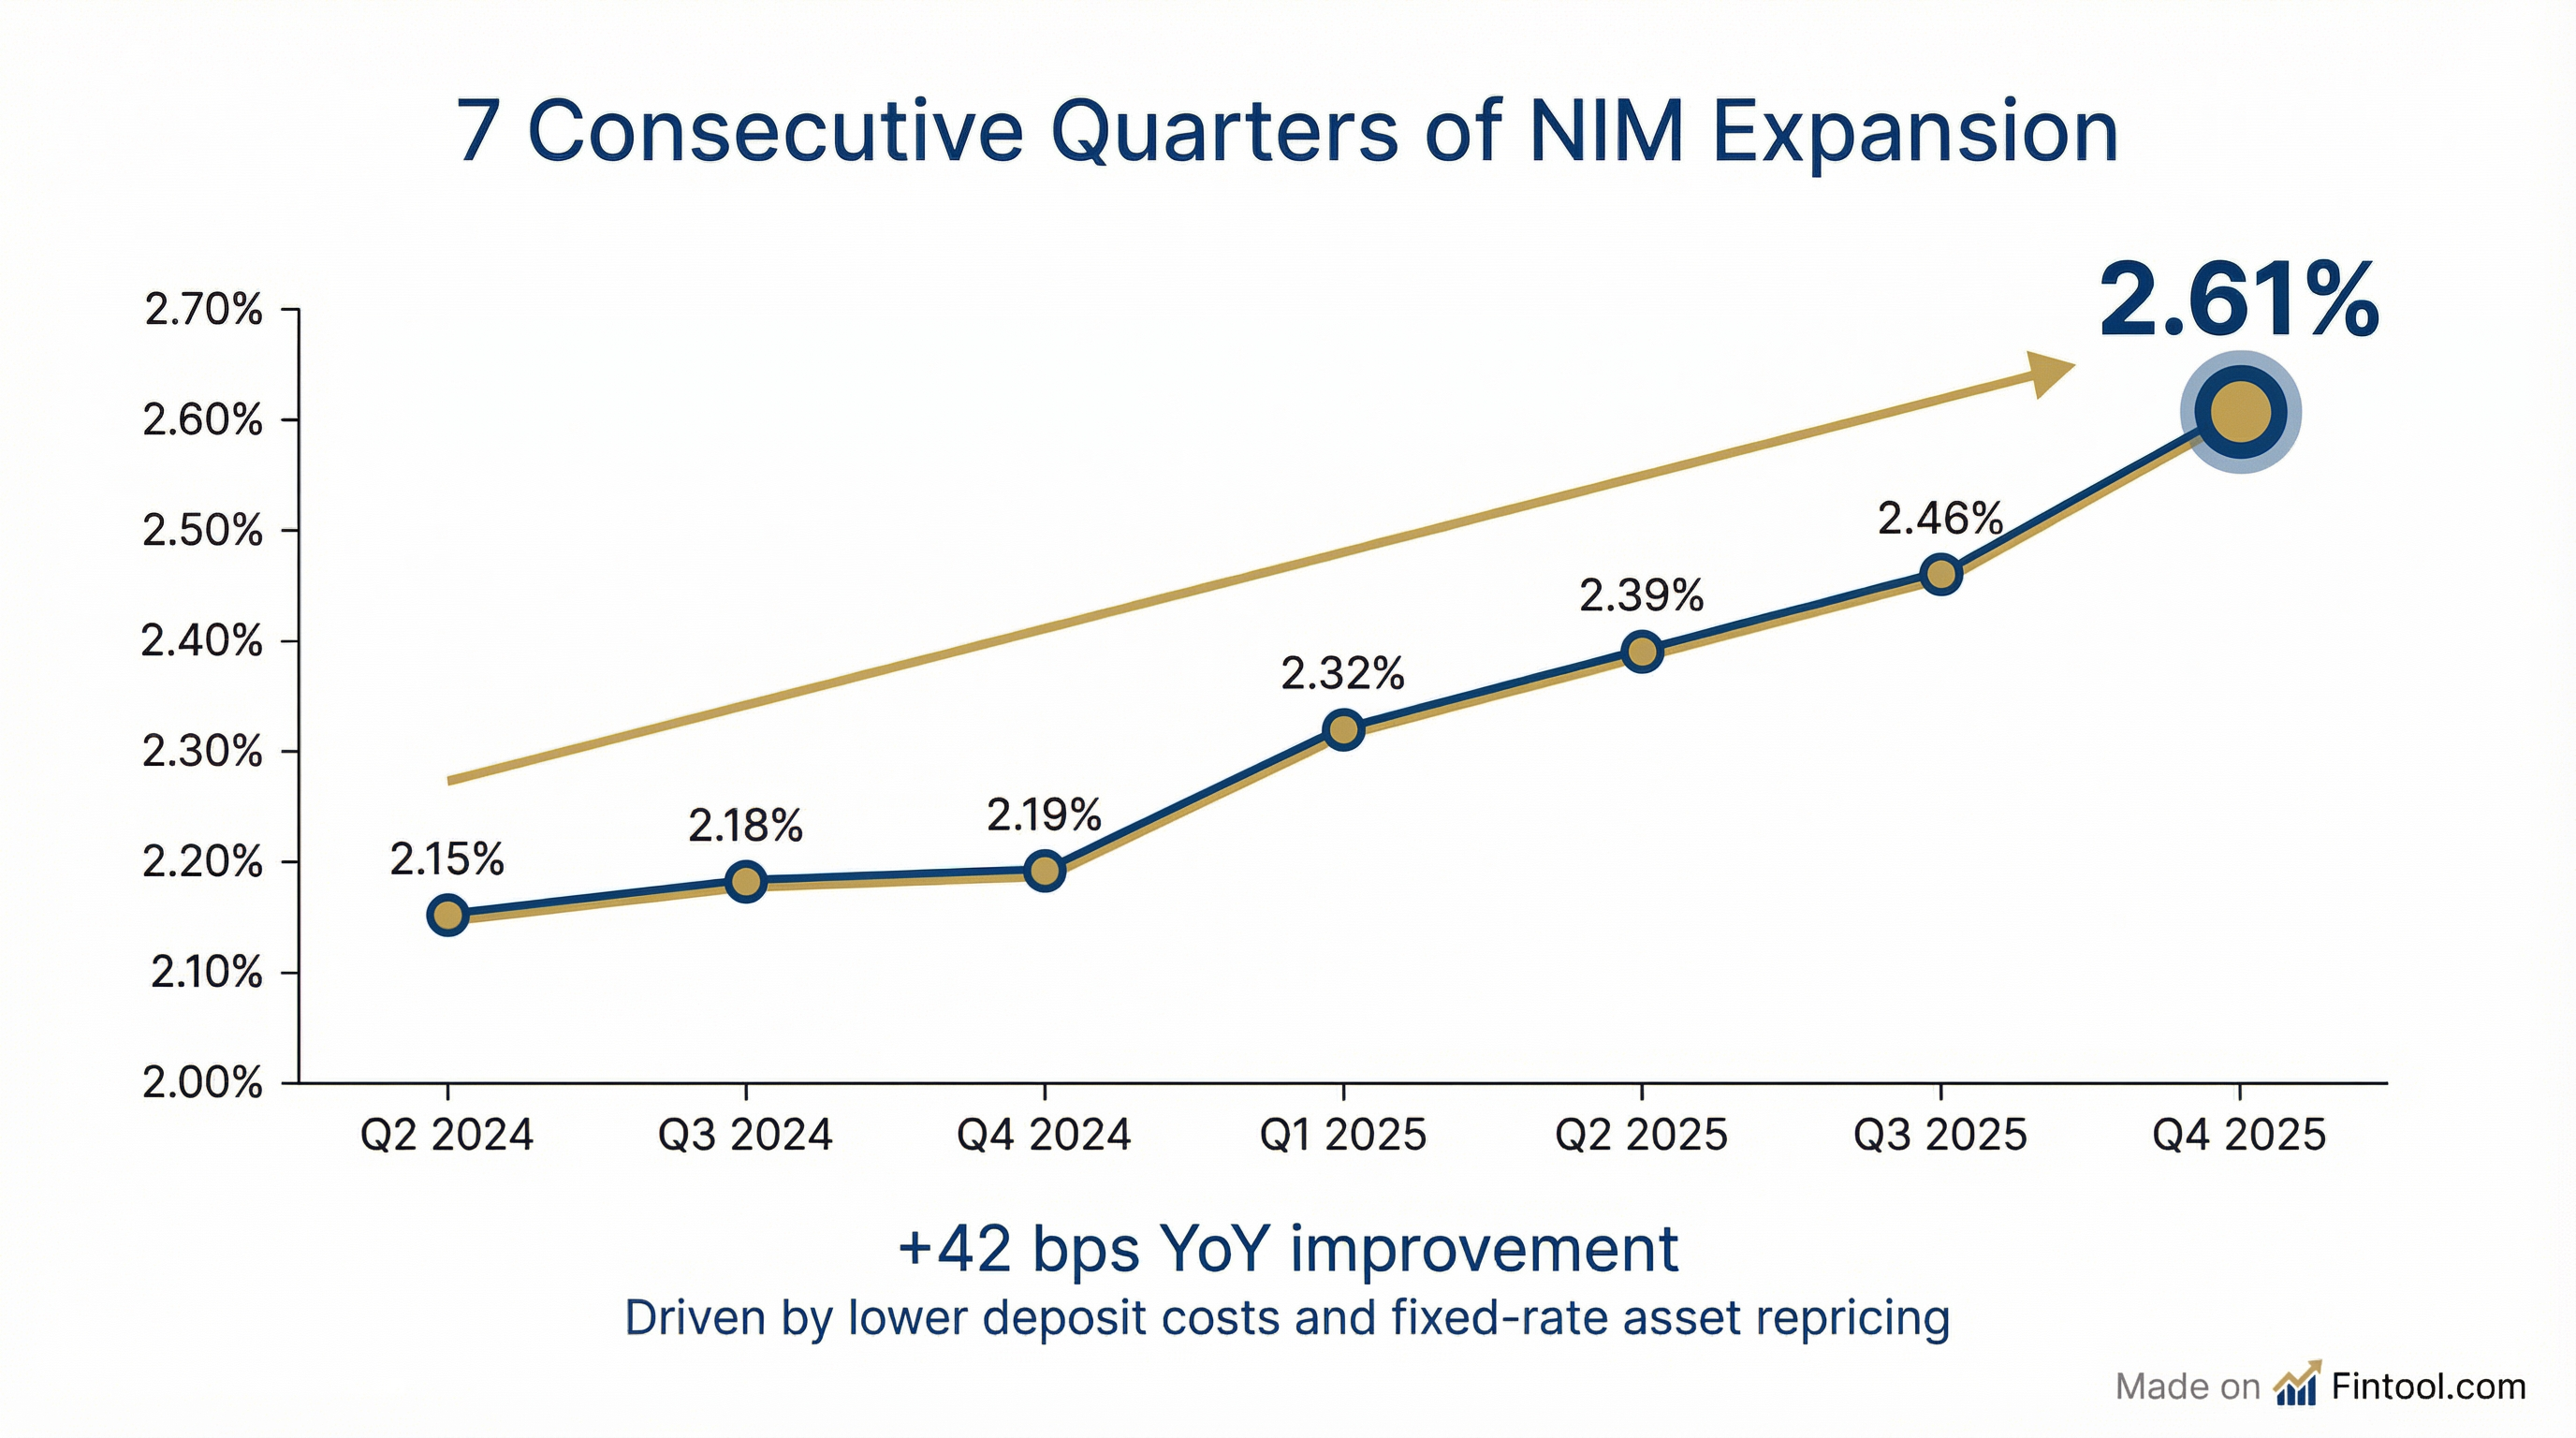
What's driving NIM higher:
- Lower deposit costs: Average cost of total deposits fell to 1.43% from 1.59% in Q3 — a 16 bps improvement
- Fixed-rate asset repricing: Higher-yielding loans replacing maturing lower-rate assets
- Deposit mix shift: Noninterest-bearing deposits grew 6.6% sequentially, now 27.2% of total deposits
Net interest income was $145.4 million, up 6.4% from Q3 2025 and up 21.0% year-over-year.
Profitability Metrics — All Up
What Did Management Say?
"Bank of Hawai'i completed 2025 with strong financial performance. We continued to deliver consistent growth in net interest income and margin for the seventh consecutive quarter. Noninterest-bearing deposit balances increased 6.6% from the linked quarter and end of period total deposits and total loans and leases increased modestly. Credit quality remains outstanding, and we continue to be disciplined in managing expenses."
— Peter Ho, Chairman and CEO
What's the Competitive Position?
Bank of Hawaii maintains a dominant position in its core market. In a 2025 brand awareness study, BOH achieved 79% unaided brand awareness when Hawaii residents were asked "what financial services company comes to mind" — far ahead of competitors.
The bank operates in a unique deposit market where five local competitors hold 95% of bank deposits, creating a stable oligopoly with consistent long-term growth.
How Is Credit Quality?
Pristine. Bank of Hawaii's credit metrics remain among the best in the regional banking sector.
Net charge-offs were 0.12% annualized in Q4, up from 0.07% in Q3 but still minimal. Non-performing assets declined to 0.10% from 0.12% in Q3.
Why credit is so strong: 80% of the loan portfolio is real estate-secured with a weighted average LTV of 51%. The bank operates exclusively in Hawaii and the West Pacific, markets with constrained real estate supply.
Loan Portfolio Quality Detail:
CRE LTV Distribution: 63.8% of CRE loans have LTV ≤60%, and only 1.6% ($69MM) have LTV >80%.
What Changed From Last Quarter?
Key changes:
- Deposit costs falling faster — Down 16 bps as benchmark rates declined and the bank repriced time deposits lower
- Noninterest-bearing growth — Best quarterly increase in deposit mix, now 27.2% of total deposits
- Share buybacks resumed — First repurchases since the regional bank stress of 2023. Bought 76,500 shares at $5.0 million
- Merchant services sold — Recognized gain on sale, offset by loss on investment securities repositioning
Capital Return — Buybacks Ramping Up
Bank of Hawaii resumed share repurchases in Q4 2025 and signaled a meaningful acceleration:
- Q4 repurchases: $5 million (76,500 shares at ~$65 average)
- 2026 guidance: $15-20 million per quarter
- Authorization remaining: $121 million
- Quarterly dividend: $0.70 per share (unchanged)
Capital ratios remain well above regulatory minimums:
Liquidity Position: Readily available liquidity of $10.9 billion (cash, unencumbered securities, FHLB/FRB capacity) covers 136% of uninsured/uncollateralized deposits of $8.0 billion.
How Did the Stock React?
BOH shares closed at $74.24 on January 26, up 4.9% on the day following the morning earnings release. The stock opened at $72.06 and traded as high as $75.34 intraday, reflecting strong positive reaction to the results and guidance.
Year-to-date 2026 performance: The stock is trading near its 52-week high of $76.00, up significantly from the $57.45 low.
Q&A Highlights — What Analysts Asked
NIM Trajectory to ~290 bps by Year-End 2026
Analysts pressed for margin outlook. Management confirmed NIM could reach "near the 290 range" by end of 2026, up from 2.61% today. The December exit rate was 2.67%, already 6 bps above Q4 average.
"We believe NIM by the end of 2026 could come in near the 290 range." — Peter Ho, Chairman and CEO
Three drivers supporting continued expansion:
- Fixed asset repricing has "a couple of years at least" of runway
- Deposit beta expected to reach at least 35% at terminal rate (vs 31% today)
- 52% of CDs maturing in Q1 2026 at 3.1% average — expected to renew at 2.25%-3.0%
Loan Growth Improving to Mid-Single Digits
Pipeline visibility has improved. Commercial real estate and middle market pipelines both building, while residential saw solid Q4 supported by project closings.
"2026, at least from our forward vision into at least the first quarter, feels like it's going to be more of a mid-single-digit type of year for us. So a bit of an improvement [from flat in 2025]." — Peter Ho, Chairman and CEO
Buybacks Ramping to $15-20M Per Quarter
After resuming repurchases at $5M in Q4, management signaled a meaningful step-up:
"I would anticipate that we'll be closer into the $15 million-$20 million range moving forward per quarter." — Peter Ho, Chairman and CEO
2026 Expense and Fee Guidance
Wealth Management — Targeting 10%+ Fee Growth
Investment management fees grew 2%+ linked quarter with Q4 production "one of our highest levels in a while." Pipeline remains strong.
"I think as we move forward getting into that 10% range... even higher as we have more time to build into the opportunity." — Jim Polk, President and Chief Banking Officer
Credit Update — UHERO Forecast Improved
The ACL release was supported by an improved UHERO (University of Hawaii Economic Research Organization) forecast for 2026.
Classified asset detail:
- Special Mention: $63.4M (down $46.8M YoY)
- Total Classified: $298.5M, with 86% real estate-secured at 54% weighted average LTV
What's the Outlook?
Management provided specific 2026 guidance during the Q&A session:
Tailwinds:
- NIM to ~290 bps: December spot rate at 2.67%, trajectory toward 290 by year-end 2026
- Accretive balance sheet remix: $659 million of quarterly cash flows repricing at spreads of 180 bps (5.8% reinvestment rate vs 4.0% roll-off rate)
- Deposit repricing runway: 52% of CDs maturing in Q1 at 3.1% — renewing at 2.25%-3.0%
- Deposit beta improving: Expected to reach 35%+ at terminal rate
- Hawaii economy improving: UHERO revised 2026 forecast higher, supporting credit outlook
Monitoring:
- Rate sensitivity: Fed cuts remain net positive as orderly cuts support deposit repricing
- Loan growth execution: Mid-single-digit growth target requires both consumer and commercial contribution
Key Takeaways
- NIM guidance to ~290 bps by year-end 2026 — Up from 2.61% today, with December exit rate at 2.67%
- Strong beat — EPS +2.1% and revenue +0.7% above consensus, 7th consecutive quarter of NIM expansion
- Credit pristine — 0.10% NPAs, 0.12% NCO rate; UHERO improved 2026 outlook supports reserve release
- Buybacks accelerating to $15-20M/quarter — Up from $5M in Q4, $121M authorization remaining
- Mid-single-digit loan growth — Improved pipeline visibility vs flat 2025
- Wealth management opportunity — Targeting 10%+ fee growth
Related: Bank of Hawaii Company Profile | Q4 2025 Earnings Call Transcript | Q3 2025 Earnings Recap